2D Non-Linear Phase Plane, Chaos and Julia
Intro
We have hopped from the one-dimensional flow to the two-dimensional flow. We will now look at dynamics of the two-dimensional cases when we have non-linearity. Lets start here by studying closed orbits. A general two dimensional flow is given by:
\[\dot{x} = f_1(x,y) \\ \dot{y} = f_2(x,y)\]The main difference with the linear systems, is that here it becomes increasingly difficult to find the closed orbits analytically. But we can remark its most important qualities:
- Fixed points: Those where the flow is zero. They are the most important points in the phase plane.
- Closed orbits: Those which satisfy a periodic solution of the system. The behavior cf trajectories near them are also specially important.
- Stable and unstable fixed points: Those which are stable or unstable and / Liapunov, as we defined in the previous notebook.
- Nullclines: Those which are the solutions of the system when one of the variables is constant. They are the lines where the flow is zero.
example 1: \(f_1(x,y) = x + e^{-y}\) and \(f_2(x,y) = -y\)
We’ll begin by searching the fixed points of the function. We can do this by setting the flow to zero:
\[0 = x + e^{-y}\ \ \text{and}\ \ 0 = -y\] \[\therefore y^* = 0 \ \ \& \ \ x^* = -1\]We note that this gives us for free the nullclines of the system:
When \(y=0\) the flow goes along the \(x\) axis, also, when \(x=e^{-y}\) the flow goes only along the \(y\) axis. Thus, we can begin by drawing the nullclines and fixed points.
After getting the nullclines, we can now find the fixed points. We can do this by setting the flow to zero, and of course… the rest of the ODE:
pde(x, y) = Point2f(f11(x, y), f12(x, y))
x = -2:0.1:2; y = -2:0.1:2
fig = CairoMakie.Figure(resolution = (600, 600), fontsize = 22, fonts = (;regular="CMU Serif"))
ax = fig[1, 1] = Axis(fig, xlabel = L"x", ylabel = L"y")
z = [log(f11(x, y)^2+f12(x, y)^2 ) for x in x, y in y]
fs = CairoMakie.heatmap!(ax, x, y, z, colormap = Reverse(:plasma))
CairoMakie.streamplot!(ax, pde, x, y, colormap = Reverse(:plasma))
CairoMakie.lines!(x, x.*0; color = :black, markersize = 10, label = "")
CairoMakie.lines!(x*0, x; color = :black, markersize = 10, label = "")
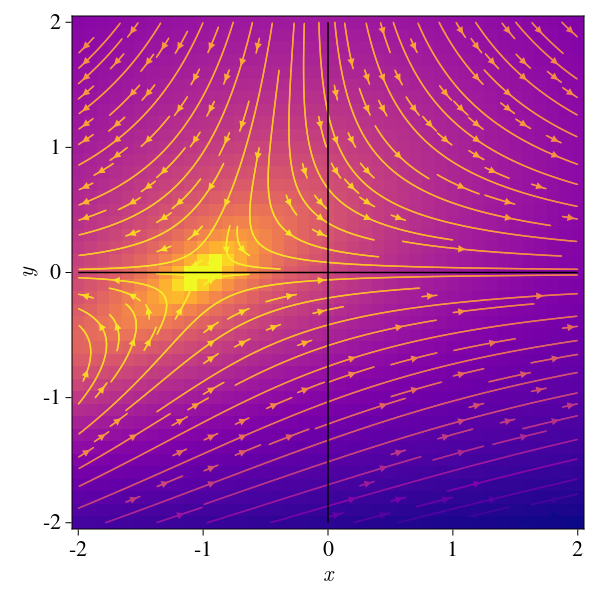
This is acurately what we expected. We can see that the fixed points are the points where the flow is zero, and the nullclines are the lines where the flow is zero. We can also totally infer the behavior of the trajectories near the fixed points:
xs, ys = Vector(-4:0.2:4), Vector(-4:0.2:4)
xx, yy = meshgrid(xs, ys)
ts = 0:0.2:3
color(x, y) = log10(sqrt(f11(x, y)^2 + f12(x, y)^2))
anim = @Plots.animate for t in ts
    Plots.heatmap(xs, ys, color, xlims = (-2, 2), ylims = (-2, 2), colorbar = false, aspect_ratio = 1, legend = false, grid = false, framestyle = :zerolines, title = "Phase Plane")
    Plots.plot!(xs12, ys12, f12, levels=[0], grid=false, color=:red, label = "vy = 0")
    Plots.plot!(xs12, ys12, f11, levels=[0], label = "vx = 0", color=:blue)
    @fastmath for x in xs, y in ys
        xi = x + (f11(x, y) * t)
        yi = y + (f12(x, y) * t)
        @inbounds Plots.scatter!([xi], [yi], color = :black, markersize = 2, label = "")
    end
end
 .
.
\(\)
Uniqueness
Lets suppose that we have an initial value problem for the system with starting at \(\vec{x_0} = (0, 0)\). If the function \(\vec{x}(t)\) is smooth and continuos, then for \(x_0\) there is a unique solution in the interval \([-T, T]\) about \(t=0\). This is because the system is autonomous, and thus, the solution is independent of the initial time, which is just a consequence of the fact that in 2D different trajectories never intersect in points different from the fixed points.
Linearization
As we have done in the 1D case, it is possible to linearize the system around a fixed point. This is done by taking the Taylor expansion of the system around the fixed point for the 2D case… meaning:
\[\vec{\dot x} = \vec{f}(\vec{x}) = \begin{bmatrix} f_1(x,y) \\ f_2(x,y) \end{bmatrix} = \begin{bmatrix} f_1(x_*,y_*) + \frac{\partial f_1}{\partial x} (x-x_*) + \frac{\partial f_1}{\partial y} (y-y_*) + O\\ f_2(x_*,y_*) + \frac{\partial f_2}{\partial x} (x-x_*) + \frac{\partial f_2}{\partial y} (y-y_*) + O\end{bmatrix}\]Besides the equation above is correct, it is incredibly ugly. So we’ll rewrite it in a more compact way with matrix notation:
\[\begin{bmatrix} \dot x \\ \dot y \end{bmatrix} =\underbrace{\begin{bmatrix} \partial_x f_1 & \partial_y f_1 \\\partial_x f_2 & \partial_y f_2 \end{bmatrix}}_{\text{Jacobian}} \begin{bmatrix} x \\ y \end{bmatrix} + O\]This approximation is in fact quite good only if the fixed points not a borderline case, (e.g a non-isolated fixed point, centers or starts), which can be perturbed by small effects.
Example 2:
Using the tweakable parameter \(\alpha\) lets study the behavior of the system \(f_1(x,y) = -y + \alpha x (x^2 + y^2)\) and \(f_2(x,y) = x + \alpha y (x^2 + y^2)\).
As suggested, we linearize the system around the fixed point \((0,0)\), and we get, giving the Jacobian matrix:
\[J = \begin{bmatrix} \alpha (3 x^2 + y^2) & 2 \alpha x y -1 \\ 2 \alpha x y & \alpha (x^2 + 3y^2) \end{bmatrix}\]which we have to evaluate at the fixed point \((0,0)\), giving:
\[J = \begin{bmatrix} 0 & -1 \\ 1 & 0 \end{bmatrix}\]This ended up being a linear system, which we can solve by hand, or note it corresponds to a rotation. The eigen decomposition of the matrix is:
eigvals([0 -1; 1 0])
 0.0 - 1.0im
 0.0 + 1.0im
So, we obtain a system with a fixed point \((0,0)\), which is a center, and with a characteristic elliptic behavior coming from the complex eigenvalues. Lets use our computation capabilities to study this system and see if this is true.
figs = []
for a = [-1, 0, 1]
    f21(x, y) = -y + a * x *  (x^2 + y^2)
    f22(x, y) = x + a * y *  (x^2 + y^2)
    z = [log10(f21(x, y)^2 + f22(x, y)^2) for x in xs12, y in ys12]
    pde(x, y) = Point2f(f21(x, y), f22(x, y))
    x = -2:0.1:2; y = -2:0.1:2
    fig = CairoMakie.Figure(resolution = (600, 600), fontsize = 22, fonts = (;regular="CMU Serif"))
    ax = fig[1, 1] = Axis(fig, xlabel = L"x", ylabel = L"y")
    fs = CairoMakie.heatmap!(ax, x, y, z, colormap = Reverse(:plasma))
    CairoMakie.streamplot!(ax, pde, x, y, colormap = Reverse(:plasma), gridsize = (32, 32), arrow_size = 10)
    CairoMakie.lines!(x, x.*0; color = :black, markersize = 10, label = "")
    CairoMakie.lines!(x*0, x; color = :black, markersize = 10, label = "")
    push!(figs, fig)
end
For \(\alpha < 0\) we have a fixed point, which is a center, and the trajectories are convergent spirals:
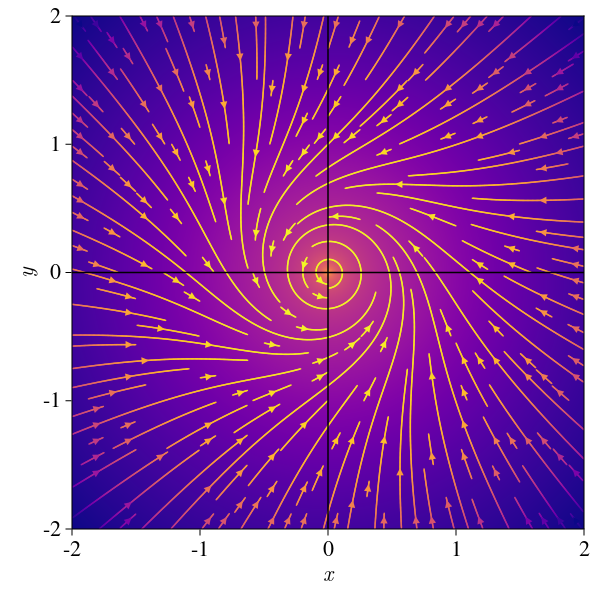
with \(\alpha > 0\) we have a fixed point, which is a center, and the trajectories are divergent spirals:

and for \(\alpha = 0\) we have a fixed point, which is a center, and the trajectories are elliptic:
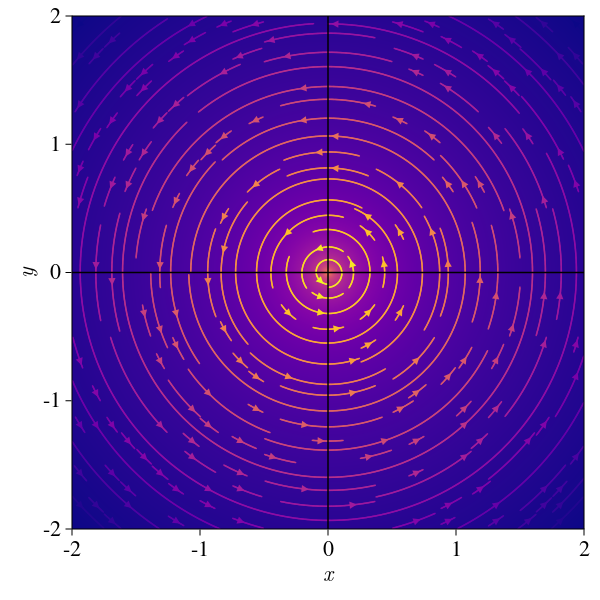
Here is the twistplot, if we would have trusted the linearization, we would have obtained only linear system (\(\alpha = 0\)), which is not always the case. This is the reason to be very careful with linearization, and to always check that you are not working with a borderline case and only do it if those are:
- Sources (both eigenvalues of the Jacobian matrix have possitive real part)
- Sink (both eigenvalues of the Jacobian matrix have negative real part)
- Saddle (one eigenvalue has negative real part and the other one has possitive real part)
Those cases whose eigenvalues have a real part are called hyperbolic, and for them, there is a homoeomorphism (Hartman-Grobman theorem) between the system’s phase plane and the plane of the approximated version, which is the reason why we can linearize them.
Lokta-Volterra Model
This is probably one of the most famous models in the field of dynamical systems. It is a model of the interaction between two species, a predator and a prey and for historical reasons, it deserves a special mention.
The model (also known as the predator-prey model), is a set of mathematical equations that describe the dynamics of a biological system in which two species interact. The model describes how the populations of the two species change over time, based on the interactions between them.
The model is represented by two differential equations, one describing the rate of change of the prey population and the other describing the rate of change of the predator population. These equations take into account factors such as the growth rate of the prey population, the rate at which the predators consume the prey, and the rate at which the predators reproduce. The model can be used to predict the long-term behavior of the populations, such as the point at which the predator population will crash due to a lack of prey, or the point at which the prey population will recover after a period of heavy predation. It is used to study many different types of ecological systems, from simple food chains to complex ecosystems.
A down to earth case would look like this:
\[\dot r = r(\alpha_r - r - 2w), \ \ \text{and} \ \ \dot w = w(\beta_w - w - r)\]where \(r\) is the number of rabbits and \(f\) is the number of foxes. The first equation describes the growth of the rabbit population, and the second describes the growth of the fox population. The first term in each equation is the growth rate of the population, the second term is the rate at which the population is eaten by the other species, and the third term is the rate at which the population reproduces. \(\alpha_r\) and \(\beta_w\) are the reproduction rates of the rabbits and foxes, respectively, which are both positive reals.
If we write the system in a more compact way using the Jacobian matrix, we get:
\[\begin{bmatrix} \dot r \\ \dot w \end{bmatrix} = \begin{bmatrix} \alpha_r - 2r - 2w & -2r \\ -w & \beta_w - r - 2w \end{bmatrix} \begin{bmatrix} r \\ w \end{bmatrix}\]To find the fixed points, we look for the kernel space of the Jacobian matrix, giving us the following system of equations:
\[\text{Fixed Points:}\begin{cases} r = 0, w = 0\ \ (1)\\ r = 0, w = \beta_w \ \ (2)\\ r = \alpha_r, w = 0 \ \ (3)\\ r = 2\beta - \alpha, w = \alpha - \beta\ \ (4)\end{cases}\]Let us inspect each one of the points:
- (1) -> (0,0) is a center:
- (2) -> (0,\(\beta\)):
The eigenvalues are \(\lambda_1 = \alpha - 2\beta\) and \(\lambda_2 = -\beta\). Since we know that \(\alpha > 0\) and \(\beta > 0\), we know that \(\lambda_2 < 0\). If the rabbits reproduce at least twice as fast as the foxes then \(\lambda_1>0\) and we would have a saddle point. Otherwise, we would have a sink point.
- (3) -> (\(\alpha\),0):
The corresponding eigenvalues are \(\lambda_1 = -\alpha\) and \(\lambda_2 = \beta - \alpha\). Obviously we know that \(\alpha > 0\), so everything depends on the value of \(\beta - \alpha\). If \(\beta - \alpha > 0\) we have a saddle point, otherwise we have a sink point.
- (4) -> \((\alpha - \beta, 2\beta - \alpha)\):
Here the eigenvalues are \(\lambda_{1,2} = -\beta \pm \sqrt{-4\alpha^2 + 12 \alpha \beta - 7\beta^2}/2\), which can either be an spiral or a saddle point depending on the sign of the discriminant.
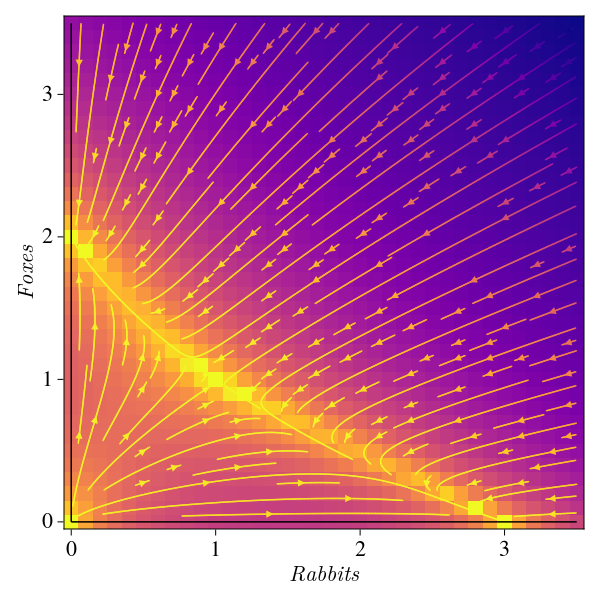
The have a better understanding of the system, we consider the same constant as Strogatz, \(\alpha = 3\) and \(\beta = 2\). Thus:
- (1) -> (0,0) is a center
- (2) -> (0,2) is a sink
- (3) -> (3,0) is a sink
- (4) -> (1,1) is a saddle.
The phase portrait is the following:
rd = (x, y) -> x *(3-x-2y)
wd = (x, y) -> y *(2-x-y)
pde(x, y) = Point2f(rd(x, y), wd(x, y))
x = 0:0.1:3.5; y = 0:0.1:3.5
fig = CairoMakie.Figure(resolution = (600, 600), fontsize = 22)
ax = fig[1, 1] = Axis(fig, xlabel = L"Rabbits", ylabel = L"Foxes")
z = [log((rd(x, y)^2+wd(x, y)^2)^0.5 ) for x in x, y in y]
fs = CairoMakie.heatmap!(ax, x, y, z, colormap = Reverse(:plasma))
CairoMakie.streamplot!(ax, pde, x, y, colormap = Reverse(:plasma), gridsize = (32, 32), arrow_size = 10)
CairoMakie.lines!(x, x.*0; color = :black, markersize = 10, label = "")
CairoMakie.lines!(x*0, x; color = :black, markersize = 10, label = "")
fig
Lets see how the system behaves for this specific configuration of parameters:
function lotka_volterra!(du,u,p,t)
    r, w = u;  α,β = p
    du[1] = dr = r * (α - r - 2w)
    du[2] = dw = w * (β - r - w)
end
u₀ = [0.5, 0.4]
tspan = (0.0, 10.0)
p = [3.,2.]
prob = ODEProblem(lotka_volterra!,u₀,tspan,p)
sol = solve(prob);
Plots.plot(sol, labels = ["Rabbits" "Foxes"], lw = 3, xlabel = "Time", ylabel = "Population", title = "Lotka-Volterra Model")
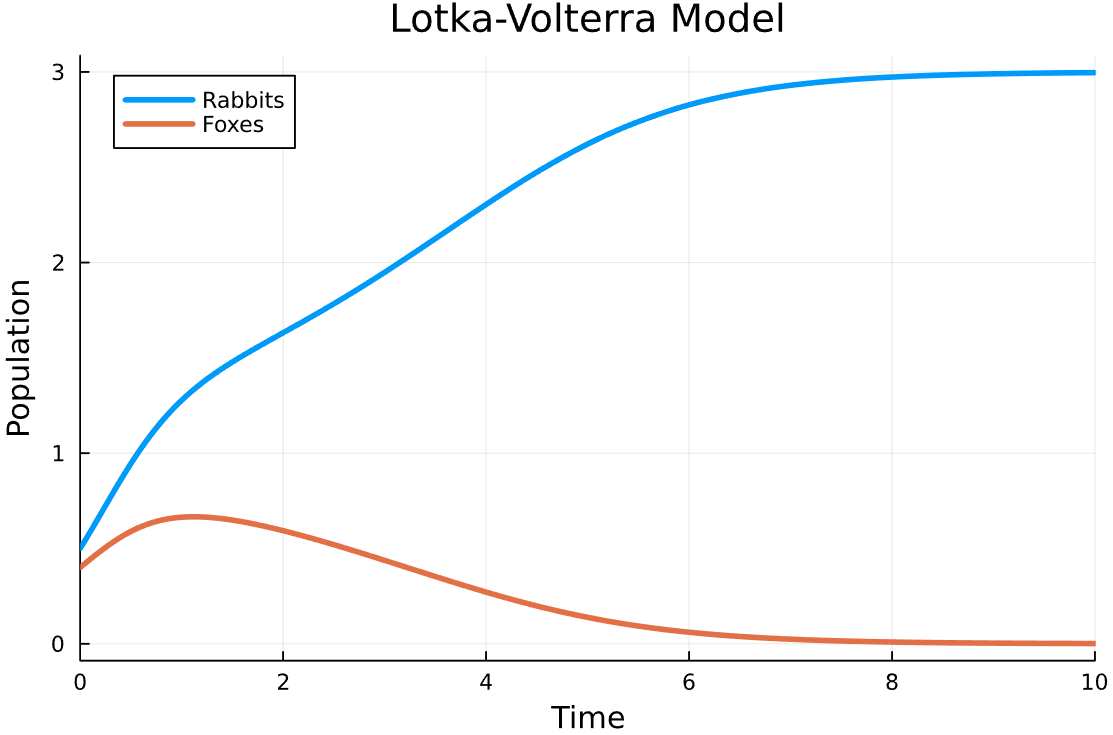
We can note that with the same initial condition, the parameters \(\alpha\) and \(\beta\) play a incredibly big role in the behavior of the system. If we change the parameters, we can get very different results:
alphas = 0:0.2:5
betas = 0:0.2:4
anim = @Plots.animate for a in alphas, b in betas
    u₀ = [0.5, 0.2]
    tspan = (0.0, 2.0)
    p = [a, b]
    prob = ODEProblem(lotka_volterra!,u₀,tspan,p)
    sol = solve(prob);
    Plots.plot(sol, labels = ["Rabbits" "Foxes"], lw = 3, xlabel = "Time", ylabel = "Population", title = "Lotka-Volterra α = $$a,  β=$$b ", ylims=(0, 3.5))
end
gif(anim, "lotka_volterra.gif", fps = 10)
Conservation in physics
We know that if the Lagrangian of any system we study is time-independent, then the system is conservative. This is because the Hamiltonian is constant, and the Hamiltonian is the sum of the kinetic and potential energy. If the potential energy is constant, then the kinetic energy must be constant, and the system is conservative.
Also, we can recall the connection between the potential function and the speed of the system. If we have a system with a potential function \(V(x)\) it is straight to compute a force and from it the acceleration of the system. Thus, we have:
\[\begin{bmatrix} v_x \\ v_y \end{bmatrix} = -\frac{1}{m}\frac{d}{dt}\begin{bmatrix} \partial_x V\\ \partial_y V \end{bmatrix}\]Example: Consider a particle moving in the potential \(V = -\frac{1}{2}x^2 + \frac{1}{4}x^4\)
It is easy to compute the force: \(F(x) = -x + x^3\). Supposing this is a \(m=1\) particle, we can compute the acceleration: \(\"x = -x + x^3\)
Let us introduce the substitution \(\dot x = y\). Then, we have a complete 2D system of the form:
\[\begin{bmatrix} \dot x \\ \dot y \end{bmatrix} = \begin{bmatrix} y \\ x - x^3 \end{bmatrix} = \begin{bmatrix} 0 & 1 \\ 1-x^2 & 0 \end{bmatrix}\begin{bmatrix} x \\ y \end{bmatrix}\]So two initial conditions yield fixed points: the center \((0.0)\) and the fixed point \((\pm 1,0)\). For the rest state, the system is quite trivial, but when \(x_0 = \pm 1\) the eigenvalues are \(\lambda_1 = 0\), so those are also centers. The phase portrait is the following:
xd = (x, y) -> y
yd = (x, y) -> x - x^3
pde(x, y) = Point2f(xd(x, y), yd(x, y))
x = -2:0.1:2; y = -1:0.1:1
fig = CairoMakie.Figure(resolution = (600, 600), fontsize = 22)
ax = fig[1, 1] = Axis(fig, xlabel = L"x", ylabel = L"F(x)")
z = [log((xd(x, y)^2+yd(x, y)^2)^0.5 ) for x in x, y in y]
fs = CairoMakie.heatmap!(ax, x, y, z, colormap = (:plasma))
CairoMakie.streamplot!(ax, pde, x, y, colormap = (:plasma), gridsize = (32, 32), arrow_size = 10)
CairoMakie.lines!(x, x.*0; color = :black, markersize = 10, label = "")
CairoMakie.lines!(y*0, y; color = :black, markersize = 10, label = "")
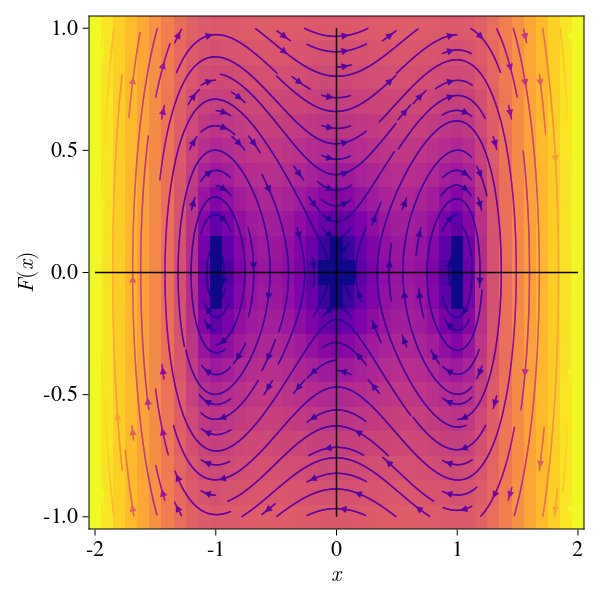
Here we can see that for each one of the centers, there exists a family of orbits that remain near them (i.e. we have Liapunov stability). Also, the iso-contours refer to paths which keep the energy \(E=\frac{\dot{x^2}}{2} - \frac{1}{2}x^2 + \frac{1}{4}x^4\) constant. But that is not all, we have the
Let us now have a down to earth visualization of the system for a bunch of initial conditions:
function plot_ode(fx, fy, xs, ys; to_scatter=[])
    f(x, y) = log10((fx.(x, y).^2 + fy.(x, y).^2 +1))^0.5
    p1 = Plots.contour(xs, ys, f, xlims=(-2, 2), ylims=(-2, 2), colorbar = false, aspect_ratio = 1, legend = false, grid = false, framestyle = :zerolines, title = "Phase Plane")
    Plots.heatmap!(xs, ys, f, xlims=(-2, 2), ylims=(-2, 2))
    xs,ys = meshgrid(range(minimum(xs), stop=maximum(xs), length=20),
        range(minimum(ys), stop=maximum(ys), length=20))
    AAf(x, y) = [fx(x, y); fy(x, y) ] ./ (10*f(x, y))
    Plots.quiver!(xs, ys, quiver=AAf, c=:blue)
    Plots.scatter!([to_scatter[1][1]], [to_scatter[1][2]], color = :white, markersize = 10)
    return p1
end
function plot_potential(Vx; to_scatter = [])
    p2 = Plots.plot(Vx, xlims=(-2, 2), ylims=(-2, 2), colorbar = false, aspect_ratio = 1, grid = false, framestyle = :zerolines, title = "Energy")
    x = to_scatter[1][1]
    y = Vx(x); K = 0.5*x^2
    Plots.scatter!([x], [y], color = :red, markersize = 10, label = "Potential")
    Plots.scatter!([x], [K], color = :green, markersize = 10, label = "Kinetic")
    return p2
end

fx(x, y) = y
fy(x, y) = x - x^3
Vx(x) = -1/2*x^2 + 1/4*x^4
ts = 1:1:101; N = 20
f(x, y) = log10((fx.(x, y).^2 + fy.(x, y).^2 +1))^0.5
AAf(x, y) = [fx(x, y); fy(x, y) ] ./ (10*f(x, y))
rand_xs, rand_ys = rand(N, length(ts)) .* 2 .- 1, rand(N, length(ts))
@gif for i in 1:1:N, t in ts[2:end]
    p1 = Plots.contour(-2:0.1:2, -2:0.1:2, f, xlims=(-2, 2), ylims=(-2, 2), colorbar = false, aspect_ratio = 1, legend = false, grid = false, framestyle = :zerolines, title = "Phase Plane")
    Plots.heatmap!(p1, -2:0.1:2, -2:0.1:2, f, xlims=(-2, 2), ylims=(-2, 2))
    xx, yy = meshgrid(range(-2, stop=2, length=20),  range(-2, stop=2, length=20))
    Plots.quiver!(p1, xx, yy, quiver=AAf, c=:blue)
    p2 = Plots.plot(Vx, xlims=(-2, 2), ylims=(-2, 2), colorbar = false, aspect_ratio = 1, grid = false, framestyle = :zerolines, title = "Potential Energy")
    rand_xs[i, t] = rand_xs[i, (t -1)] + (fx.(rand_xs[i, (t -1)], rand_ys[i, (t -1)]) * 0.1)
    rand_ys[i, t] = rand_ys[i, (t -1)] + (fy.(rand_xs[i, (t)], rand_ys[i, (t -1)]) * 0.1)
    Plots.scatter!(p1, [rand_xs[i, t]], [rand_ys[i, t]], color = :white, markersize = 10)
    Plots.plot!(p1, [rand_xs[i, 1:t]], [rand_ys[i, 1:t]], color = :white, label="", linewidth = 5)
    Plots.scatter!(p2, [rand_xs[i, 1:t]], [Vx.(rand_xs[i, 1:t])], color = :red, label="")
    Plots.plot(p1, p2, layout = (1, 2), size = (1000, 500))
end
Reversible systems
In essence, a reversible system is a system that can be reversed in time. This is, if we have a system with a Hamiltonian \(H(x, p, t)\), where \(t\) is the time, then we can define: \(H(x, p, t) = H(x,p, -t)\)
Note that there are two main ways a Hamiltonian could get this reversibility, the first… is to just have a time-independent Hamiltonian. The second is to have a Hamiltonian that is time-dependent, but it is symmetric with respect to this variable.
For these systems, we can use the Nonlinear centers for reversible systems, which states that if \(\vec{x}*=\vec 0\) is a center of the system, with all \(\vec f(\vec{x})\) a continiosly differentiable function, Then, near the original, all trajectories are closed ones.
The pendulum
Most of the times we study the pendulum, we use a small angle approximation to turn the function into a linear one. But we can also study the pendulum as a nonlinear system. The ODE for the pendulum is:
\[\ddot \theta = -\omega^2\sin(\theta)\]Thus, we can rewrite it within the 2D framework as:
\[\begin{bmatrix} \dot \theta \\ \dot \omega \end{bmatrix} = \begin{bmatrix} \omega \\ -\omega^2\sin(\theta) \end{bmatrix}\]This contains basically infinite fixed point \((\kappa \pi,0)\). But from the periodic solution, we have the evaluated Jacobian at the origin being:
\[J_{(0,0)} = \begin{bmatrix} 0 & 1 \\ -\omega^2 & 0 \end{bmatrix}\]Given that we know \(\omega^2 > 0\), we end up having a center case. Lets now use our theorem above to note it becomes a linear system (surprisingly, the linearization is exaclty the small angle one). The small oscillations around the center are called librations.
In fact, that is the case for all \(2\kappa \pi\), so we have a family of periodic linear centers. Nevertheless, the case with \(\kappa = 2\kappa + 1\) is a bit different:
\[J_{(2\kappa + 1)\pi, 0} = \begin{bmatrix} 0 & 1 \\ \pm\omega^2 & 0 \end{bmatrix}\]Whose eigenvalues are \(\pm\omega\) and \(\pm1\), creating saddles.
Lets visualize the system as the parameter \(\omega\) changes:
@gif for ω in 0.5:0.01:2
    p1 = plot_ode((x, y) -> y, (x, y) -> (-ω^2) * sin(x), -6:0.1:6, -1.5*ω:0.1:1.5*ω)
    Plots.scatter!(p1, [0], [0], color = :white, markersize = 4)
    Plots.scatter!(p1, [-π, π], [0, 0], color = :red, markersize = 4)
    Plots.plot(p1, size = (800, 500), title = "ω = $$ω")
end
gif(anim, "pendulum01.gif", fps = 20)
While this portrait is very familiar to us, there is the option to add damping \(\gamma\) into the system. This is, we can add a friction term to the system, which is a linear term in the velocity. Thus, we have:
\[\ddot \theta = -\omega^2\sin(\theta) - \gamma \dot \theta\]Having a fixed \(\omega\) the result is the following:
ω = 2.
anim = @animate for γ in 0:0.02:5
    p1 = plot_ode((x, y) -> y, (x, y) -> -γ * y - (ω^2) * sin(x), -6:0.1:6, -1.5*ω:0.1:1.5*ω)
    Plots.scatter!(p1, [0], [0], color = :white, markersize = 4)
    Plots.scatter!(p1, [-π, π], [0, 0], color = :red, markersize = 4)
    Plots.plot(p1, size = (800, 500), title = "γ = $$γ")
end
gif(anim, "pendulum02.gif", fps=60)
Here, we have the energy total \(E\) decaying monotonically among all possible trajectories, so that the amplitude decreases as well.
function damped_pendulum!(du,u,p,t)
    θ, θ_d = u;  ω, γ = p
    du[1] = θ_d
    du[2] = -γ * θ_d - ω^2 * sin(θ)
end
u₀ = [π/2, 0.0]
tspan = (0.0, 10.0)
p = [2.0, 0.4]
prob = ODEProblem(damped_pendulum!,u₀,tspan,p)
sol = solve(prob);
p3 = Plots.plot(title="Potential/Kinetic")
Vx(v) = (1-cos(v)); Kx(v) = (v^2)/2
sc = [sol(t) for t in 0:0.1:10]
anim = @animate for (i, t) in enumerate(0:0.1:10)
    th, thp = sol(t)
    x = sin(th); y = 1-cos(th)
    # Plot the phase plane
    p1 = plot_ode((x, y)->y, (x, y)->-p[2]*y-(p[1]^2)*sin(x), -3:0.1:3, -2*p[1]:0.1:2*p[1])
    Plots.scatter!(p1, [th], [thp], color = :white, markersize = 5, size=(400, 800))
    # Plot the real pendulum
    p2 = Plots.scatter([x], [y], color = :green, markersize = 10, xlims=(-1, 1), ylims=(-0.5, 2))
    Plots.plot!(p2, [x, 0], [y, 2], color = :black, label="", linewidth = 5, title="Real system")
    # Plot the kinetic and potential energy
    Plots.plot!(p3, [0:0.1:t], Vx.([s[1] for s in sc[1:i]]), color = :red, label="")
    Plots.plot!(p3, [0:0.1:t], Kx.([s[2] for s in sc[1:i]]), color = :blue, label="")
    Plots.plot(p1, p2, p3, layout = (1, 3), size = (1000, 500))
end
gif(anim, "pendulum03.gif", fps = 10)
Conclusions
In this entry we saw the first principles behind 2D systems which are not so linear. The ideas behind linearization, and how to create the phase plane. The main concepts to keep in mind are:
- The Jacobian matrix is the matrix of the partial derivatives of the vector field, which is useful when we want to study the stability of the system in the linear regime.
- It is only safe to do the linearization when the system is ‘robust’, i.e, only for:
- Sources (both eigenvalues of the Jacobian matrix have possitive real part)
- Sink (both eigenvalues of the Jacobian matrix have negative real part)
- Saddle (one eigenvalue has negative real part and the other one has possitive real part)
Hope you enjoyed it! See you in the next post!
Reference: Nonlinear Dynamics and Chaos, by Steven Strogatz.