The rule of randomness
There exists a fascinating, but not so well-known rule that dictates to incredible detail how this statistical concept, which bears the name of American physicist Frank Benford, is a useful instrument for spotting irregularities in data sets. In this brief post, let’s take a dive into this handy property of random distributions.

The law was first discovered by Simon Newcomb when he noted that the first pages in the book of logarithms needed for his work were more worn than the rest (yes, you actually had to look up the answers in a table if you were trying to do some science back in 1880s). He then noticed that the first digits of the numbers in the book were more frequent than the rest. This observation led him to the empirical conclusion that the first digits of numbers in a data set are more frequent than the rest. A modern version of this is to notice in your scietific calculator, or laptop’s keyboard that the first are way more deteriorated than the rest.
As often occurs in science, the phenomena was rediscovered and deeper studied in the 1930s, and it has since been used in a number of industries, including auditing, fraud detection, and scientific research. Benford’s Law is based on the observation that the leading digit, or the first digit, is frequently a small number in naturally occurring data sets. In 1938, Benford submitted a paper titled “The Law of Anomalous Numbers” in the Proceedings of the American Philosophical Society, in which he described his observations and presented a formula for predicting the distribution of first digits in data sets.
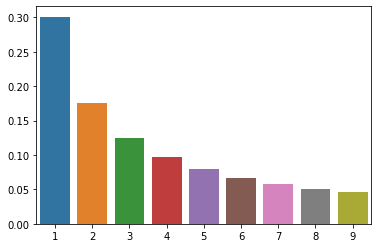
According to the law, in many naturally occurring data sets, the leading digit (the first digit) is likely to be a small number. In a data set with random numbers, for example, the probability of the first digit being a 1 is about 30%, while the probability of it being a 9 is only about 4.6%. This is because small numbers like 1 and 2 occur more frequently in naturally occurring data sets than large numbers like 8 and 9… The mathematical form of this distribution is incredibly straightforward:
\[P(N) = \log_{10}\Big(1 + \frac{1}{N}\Big)\]Here is a small Python script that generates a random data set and plots the distribution of the leading digits:
import seaborn as sns
import numpy as np

benfords_dist = lambda N: np.log10(1 + 1/N)

ns = np.arange(1, 10)
probas = benfords_dist(ns)

sns.barplot(x=ns, y=probas)
Why does this happen?
Suppose you are in a party full of people, and you suddenly wonder about the distribution of ages in the room. The ages of people in the group will likely range from 1 to 99 (or even higher), with the most common age being around 20-30 (given that you are reading this). Now, if we look at the first digit of each age, we will find that the majority of them will be a 1 or a 2. This is because ages such as 21, 22, 23, and so on will all have a leading digit of 2, while ages such as 11, 12, 13, and so on will all have a leading digit of 1.
In contrast, if we look at the ages ending in 8 or 9, such as 38 or 49, we will find that they are much less common. This is because these ages require a larger leading digit, which occurs less frequently in naturally occurring data.
How can we use this?
Benford’s Law has been found to hold true for a wide range of data sets, and shows to be extremely accurate , including financial data, population data, and even physical constants. It has been used in various fields, including auditing, fraud detection, and scientific research, to identify anomalies and patterns in data… An absourdly simple yet powerful tool.
One interesting application of Benford’s Law is in detecting fraudulent financial statements. Because fraudulent financial statements are often created by manipulating numbers, they often do not follow the distribution predicted by Benford’s Law. By comparing the distribution of the first digits in a company’s financial statements to the distribution predicted by Benford’s Law, auditors can identify potential cases of fraud. But this not only applies to financial statements, but also to any other data set that is prone to manipulation… i.e the voter’s electing data (I highly recommend this video: Why do Biden’s votes not follow Benford’s Law?).
Benford’s Law can also be used in scientific research to identify patterns in data and validate the results of experiments. For example, researchers studying the evolution of species may use Benford’s Law to detect patterns in the distribution of species over time and to identify anomalies in the data. The Benford’s Law can also be used to validate the results of experiments, such as the results of a drug trial. If the results of a drug trial do not follow the distribution predicted by Benford’s Law, then the results of the trial may be invalid.
The letters on this blog, almost paradoxically, also follow a related law. The First-Letter Law (FLL), a statistical principle that describes the distribution of digits in naturally occurring data sets, is comparable to Benford’s Law. The FLL examines the distribution of the first letters of words in a data set rather than the distribution of digits.
Similar to Benford’s Law, the FLL asserts that some letters are more likely than others to appear as a word’s first letter. For instance, the FLL asserts that the letter “a” is more likely than the letter “z” to appear as the first letter of a word. This is due to the fact that words beginning with “a” are more prevalent than words beginning with “z” in naturally occurring data sets.
The FLL has been used in various fields, including linguistics and information retrieval, to analyze and interpret data sets containing words. It can be used to identify patterns and anomalies in the distribution of first letters in a data set and to make predictions about the content of a data set.
Some caveats: Incredible applications of Benford’s law
It is very difficult to make a sense of the importance of randomness in modern scientific development, especially when Machine Learning (ML) and statics are taking over the world. Here is a collection of clever applications that I find really insightful.
-
The process behind training NNs is fundamentally based on quasirandom sequences… from the initialization of weights themselves to the stochasticity of the SGD or Adam optimizers. Several works have explored how to improve NNs using this distribution. A shootout to Rethinking Neural Networks With Benford’s Law (actually just discovered it was co-written by the amazing youtuber Yannic Kilcher).
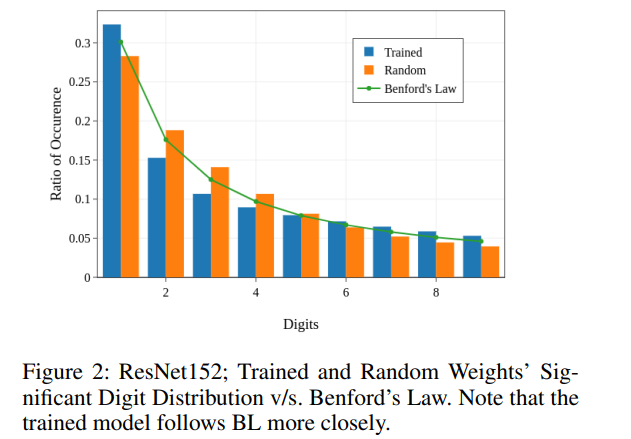
Figure by Kant, et al. -
With the explosion in computing power, the number of digits of the largest prime number has been increasing at an exponential rate. The largest prime number found so far has 24,862,048 digits (i.e. \(2^{82,589,933} − 1\)). The distribution of the first digits of the largest prime number found so far follows Benford’s law. This is a very interesting result, as it shows that the largest prime number is a natural phenomenon, and not the result of some artificial process.
-
The Standard Model of particle physics seems to provide a good description of the fundamental particles and forces of nature. However, the Standard Model has a number of shortcomings, and it is not clear whether it is the final theory of nature. One of the shortcomings of the Standard Model is that it does not explain why the masses of the fundamental particles are so different from each other. The masses of the fundamental particles are predicted by the Standard Model to follow a power law distribution, which is very different from the distribution predicted by Benford’s Law. As suggested by the great blog post Do Masses of Fundamental Particles Follow Benford’s Law?, the lack of agreement between the two distributions may indicate that the Standard Model has a fundamental, yet unknown, substructure.
-
The incredible advances in Natural Language Processing (NLP), and the rise of the Transformer architecture, have made it possible to generate text that is indistinguishable at plain view from human-written text, as the new ChatGPT shows. Especially with the number of parameters showing exponential growth (Large Language Models: A New Moore’s Law?). However, we might be able to able to detect the generated text by using FLL law, such application will prove to be very useful in a world plagued by NLP generated corpus. Practical aplications of of this can really go as far as desired… For instance, imagine if we started to incorporate this into the metrics for Masked Language Models (MLMs) such as BERT, GPT-3, etc. This would be a very interesting way to measure the quality of the generated text.
 (Animation by Clark et al, Google Research).
 -
But Large Language Models are not the only recent super-starts in the ML world… Text-to-image generation arose recently as a promising field armed with developments in difussion models. The foundations of this field is based on Generative Adversarial Networks (GANs), which are a class of adversarial ML model that are trained to generate new data that is indistinguishable from the original data. The distribution of the first digits of in the RGB values of the images generated by GANs is very different from the distribution predicted by Benford’s Law, which in principle could alow to detect artificially generated images, see for instance On the use of Benford’s law to detect GAN-generated images. The prospects of using this idea in difussion models yield a myriad of applications.
Showcasing the law on jet tagging
In high energy physics, jets are collimated beams of hadrons (particles made up of quarks and gluons) produced in the fragmentation of high-energy quarks and gluons. They are an important tool for studying the interactions of subatomic particles, as they can provide information about the underlying processes that produced them. Jet tagging is a technique used to identify and classify jets based on their properties, such as their energy, momentum, and the types of particles they contain. This can be useful in the analysis of experimental data, as it allows researchers to differentiate between different types of jets and understand their origins. Jet tagging is typically done using algorithms that analyze the properties of the particles within the jet and assign a label or tag to the jet based on these properties.
Here, I will examinate if the characteristics of the jet tagging data set follow the distribution predicted by Benford’s Law. The data set contains the number of particles in each jet, and the number of particles in each jet is a natural phenomenon, so it is reasonable to assume that the distribution of first digits in the data set follows the distribution predicted by Benford’s Law. We will use the dataset presented in the Top Quark Tagging Reference Dataset.
If we select the first digit of the energy of a random particle in the jet, we will get a random number between 1 and 9. If we repeat this process many times, we will get a distribution of first digits. The distribution of first digits in the data set should follow the distribution predicted by Benford’s Law. Let’s see if this is the case:
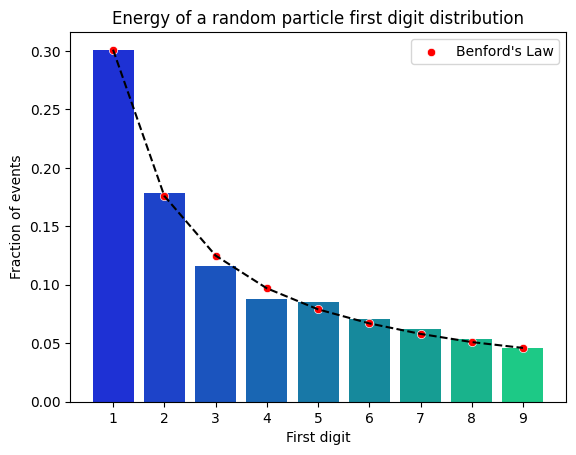
It is!, but… if we select instead the energy of the most massive particle in the jet, we will get a distribution of first digits that does not follow the distribution predicted by Benford’s Law. This is because the most massive particle in the jet is not a naturally random phenomenon, but rather the result of some physically-driven process:
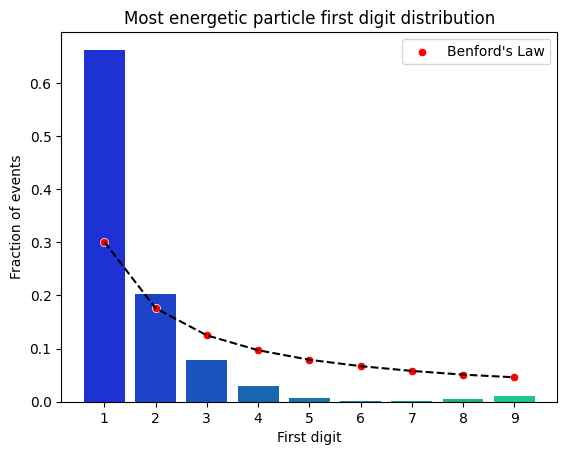
This seems to be consistent for all of the physically driven variables, if we calculate the jet-mass (simply the sum of the energies of all the masses in the jet), and then we normalize it by the number of particles in the jet, we get a distribution of first digits far from the predicted by Benford’s Law:
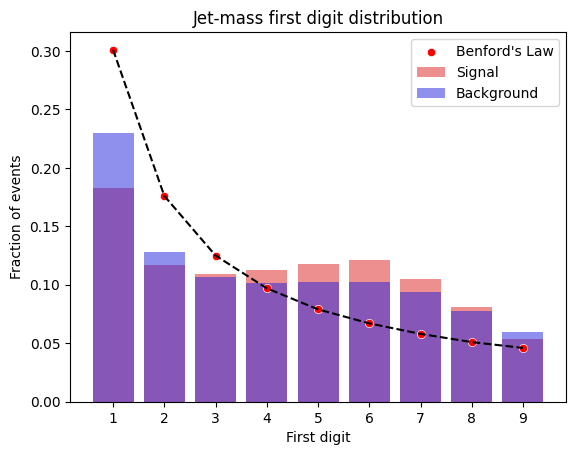
A prospect is clear… Benford’s distribution has the power to show us the difference between naturally random phenomena and physically driven data, allowing to easily get a glimpse of natural observables.
Conclusion
In conclusion, the Benford’s Law is a fascinating and powerful statistical principle that has a wide range of applications in various fields. From detecting fraudulent financial statements to identifying patterns in scientific data, the law has proven to be a valuable tool for detecting anomalies and uncovering unexpected patterns in data sets.
Understanding the Benford’s Law is an important skill for tech professionals, as it can help them analyze and interpret data sets and make more informed decisions. Whether you are an auditor looking for signs of fraud or a researcher studying the evolution of species, the Benford’s Law is a valuable tool to have in your toolkit.
So the next time you are working with data, remember the power of the Benford’s Law and how it can help you uncover hidden patterns and anomalies. With this powerful tool at your disposal, you’ll be well equipped to tackle even the most complex data sets.
Note: If you are interested in learning / working on applications of Benford law for designing ML systems and improving SOTA models, get in touch with me… I have a couple of ideas that I would like to discuss!
Disclaimer: A note on the law’s limitations
It is important to note that the Benford’s Law is a statistical principle and, like all statistical tools, it has certain limitations and assumptions. Here are some of the main limitations and assumptions of this law:
-
Benford’s Law is based on the assumption that the data set being analyzed is naturally occurring. This means that the data set should be generated by some natural process, rather than being artificially created or manipulated. If the data set has been artificially created or manipulated, the distribution of first digits may not follow the pattern predicted by the Benford’s Law.
-
As inherited from its statistical grounding, it is based on the assumption that the data set is sufficiently large. For the law to hold true, the data set should contain at least several hundred values. If the data set is too small, the distribution of first digits may not follow the pattern predicted by the law.
-
Almost certainly, you are not fitting the probability distribution exactly… And a proper usage of hypothesis testing would be to compare the observed distribution with the distribution predicted by the Benford’s Law, and to reject the null hypothesis if the observed distribution is significantly different from the distribution predicted by the Benford’s Law. This is a bit more complicated than what I have shown here, but it is a good exercise to try to do it yourself :)
-
The Benford’s Law is based on the assumption that the data set is continuous. If the data set is discrete (i.e. it consists of distinct, separate values), the distribution of first digits may not follow the pattern predicted by the Benford’s Law. Also on the assumption that the data set is not artificially rounded. If the data set has been artificially rounded, the distribution of first digits may not follow the pattern predicted by the Benford’s Law, and even further analisys is needed to understand the distribution of the NN can be done by defining Model’s Enthalpy.
It is important to keep these limitations and assumptions in mind when using the Benford’s Law. While the law can be a useful tool for detecting anomalies and patterns in data sets, it should not be used as the sole basis for making decisions or conclusions.